WebTuna Entity Performance
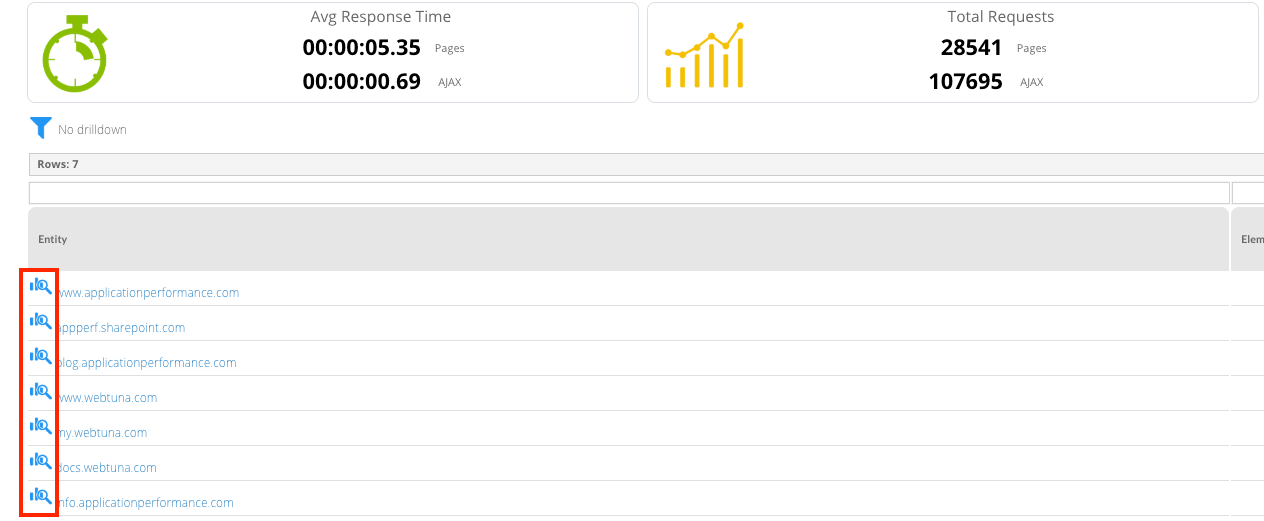
To view entity performance details, click on the blue graph/magnifying glass icon next to the entity.

Reponse time histogram
The top graph displays the distribution of response times for the selected entity. Those response times that were less than 5 seconds are coloured green (good) whilst those above 5 seconds are coloured red (bad) but the threshold can be changed under Admin - Domain Management. SLA breaches refers to the number of responses that were longer than the threshold.

Navigation Timing Breakdown
The middle graph breaks down the page response time into the separate components provided by Navigation Timing API and displays the average response time (measured in milliseconds) for each stage in the process.
For definitions of the terms used here, see http://www.w3.org/TR/navigation-timing/

Resource Timing Breakdown
The bottom graph breaks down the resource response times into the separate components provided by the Resource Timing API and displays the average response time (measured in milliseconds) for each stage in the process.

For definitions of the terms used here, see https://www.w3.org/TR/resource-timing/
